What is Regulostat Infererator (RSI)
RSI is a novel computational algorithm that aims to decipher "regulostats", which are the intrinsic molecular devices that predetermine cellular response phenotypes towards stressors that perturb cellular activities such as drugs, pathogens, etc. The basic units of a regulostat are gene pairs that their mode-of-cooperation (MOC) in term of gene-gene coexpression acting like a rheostat in determining the extent of a cellular response phenotype.
Why deciphering regulostats
In contrast to the conventional gene-based model where cellular response phenotypes are mainly explained by genetic mutations or polymorphisms, the regulostat model provides an alternative non-genetic mechanistic framework to indicate how cellular response phenotypes and phenotypic selection are predetermined by the molecular milieu in a cell. Deciphering regulostats corresponding to a given stressor to a cell type is therefore crucial to understand the underpinning molecular mechanisms that predetermined cellular response phenotypes and phenotypic selection. More importantly, the regulostat model provides a molecular framework to understand convergence of response phenotypes among different cells, molecular basis of phenotypic selection in the presence of a stressor such as the case of phenotypic drug discovery and ultimately open a new door for researchers to design combinatorial gene- or drug-based engineering technologies to engineer cells to desired cellular response phenotypes.
What are the key features of the RSI algorithm
- RSI allows ones to compute change of MOC between genes across the spectrum of cellular response phenotypes from sensitive to resistant to reveal intrinsic molecular devices that are "pre-built" to predetermine the extent of response to a stressor for a given cell.
- RSI can reconstruct "generic regulostats" from general response to stressors for a given cell type.
- RSI is capable to reconstruct regulostat specific to a given cell type-stressor response, enabling ones to characterize molecular basis of context-specific gene essentiality in response to a stressor and provides practical suggestions to manipulate genes in a combinatorial manner according to their MOC to achieve desired response phenotypes.
How RSI works (using 1000 Cell Line data as examples, see Computed Resource)
Deciphering rheostat-like gene pairs for a given drug-cancer case and reconstruction of generic regulostat
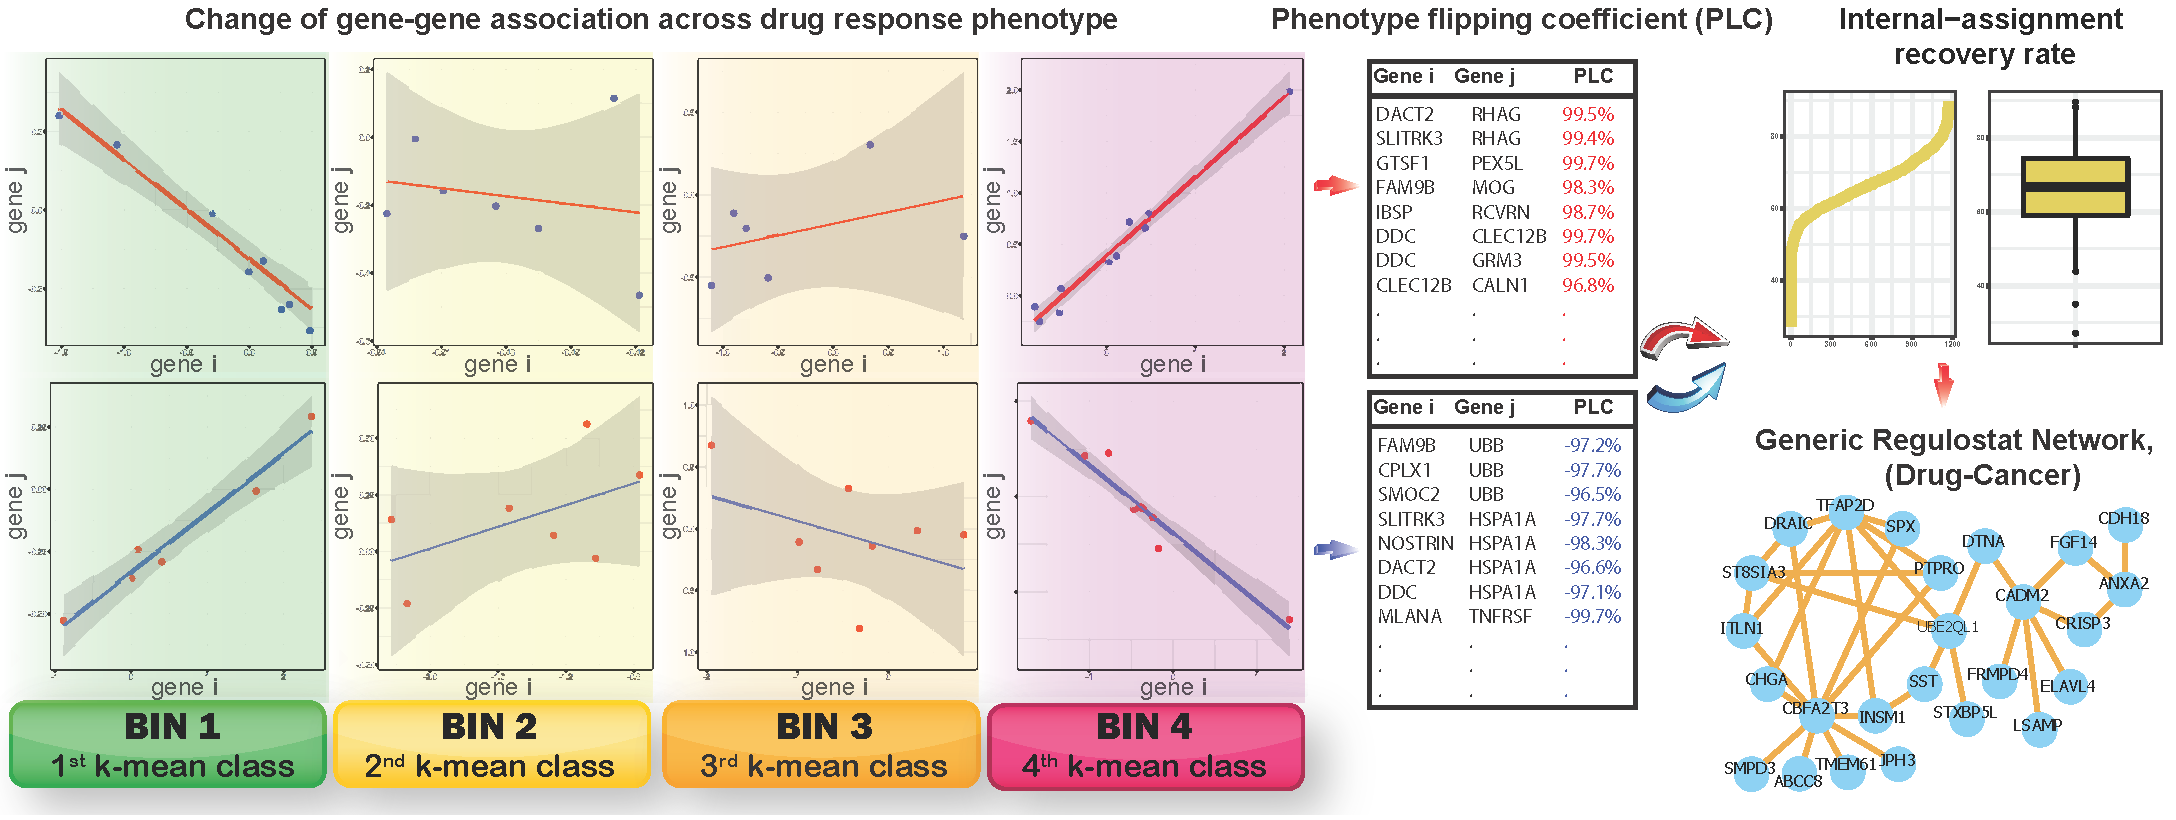
k-mean method is used to categorized cancer cell lines with drug responses measured in IC50 into respective 4 bins, with bins 1 and 4 correspond to sensitive and resistant phenotype, respectively, and bins 2 and 3 as bins representing transitional response phenotypes from sensitive to resistant, respectively. Linear regression model followed by computing standard error and confidence interval for the fittest regression line are performed in order to obtain gene pairs showing authentic strong gene-gene coexpression correlations. The phenotype flipping coefficient (PLC) is then computed from gene-gene coexpression correlation coefficients across bins 1 to 4 for a given gene pair. Gene pairs showing absolute values of PLC > 0.8 are deemed rheostat-like candidates. Positive PLC indicates positive rheostat-like mode-of-cooperation (MOC) between a pair of genes and vice versa for a gene pair showing negative PLC. Rheostat-like gene pairs are subsequently ranked using a novel devised RSI score.
Reconstruction of cancer cell line-specific regulostat that predetermined its response phenotype to a given drug
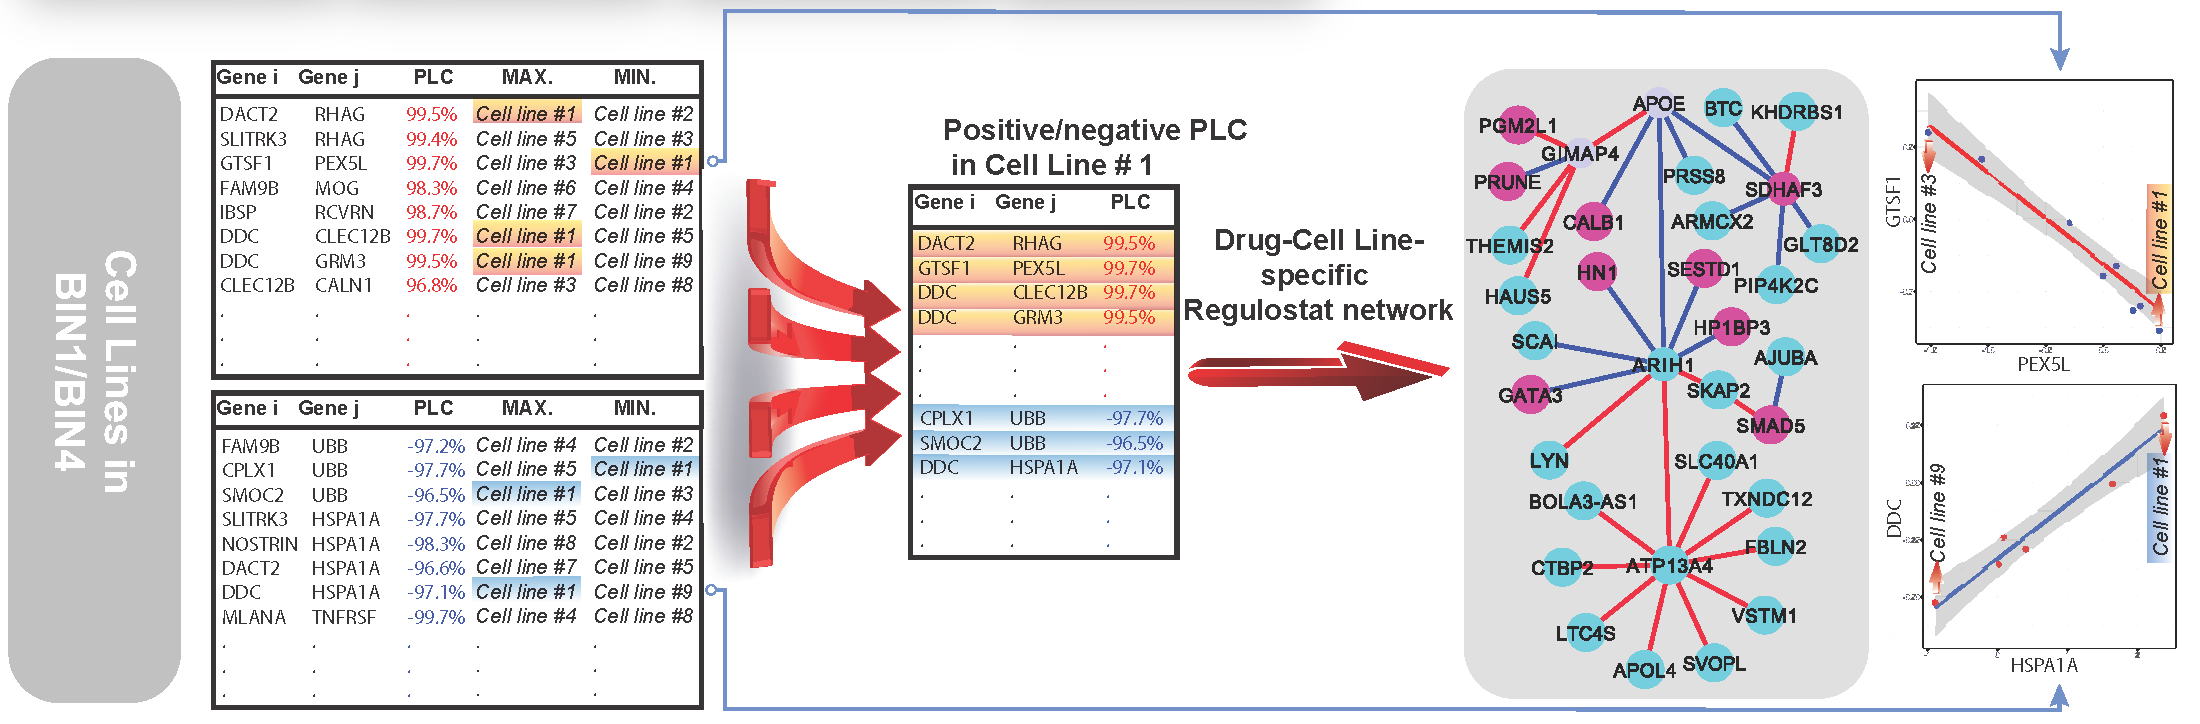
Gene-gene coexpression correlation data points of N gene pairs correspond to a cell line of interest are chosen if they show maximum or minimum point on the correlation lines of computed PLCs. The selected gene pairs are then used to reconstruct network of regulostat correspond to the selected cell line. Red nodes: genes with higher expression values; blue nodes: genes with lower expression values; red edges: gene pairs with positive PLCs; blue edges: gene pairs with negative PLCs.
Computed Resource
We applied the RSI algorithm onto 1000 Cell Line (1000CL) data that contains 1001 molecularly annotated human cancer cell lines with drug respond data correspond to 265 anti-cancer drugs [F. Iorio et al., Cell 166, 740-754 (2016)]. The final cleaned up data that meets our computation criteria contains a total of 1169 drug-cancer cases. The computed results for each drug-cancer case can be explored via Shiny app provided in this website. For further information of 1000CL data, users are encouraged to refer to Iorio et al. A Landscape of Pharmacogenomic Interactions in Cancer. Cell. 2016 Jul 28;166(3):740-754. doi: 10.1016/j.cell.2016.06.017. and Barretina et al. The Cancer Cell Line Encyclopedia enables predictive modelling of anticancer drug sensitivity. Nature. 2012 Mar 28;483(7391):603-7. doi: 10.1038/nature11003.
Source Code
Source code download is passcode protected. Please contact us for the passcode for downloading the RSI source code.
soure code